
What do you get when Planet, Microsoft, and the Nature Conservancy walk into a bar? Probably some pretty wonky and in-the-weeds convos, but also, the potential for a productive collab.
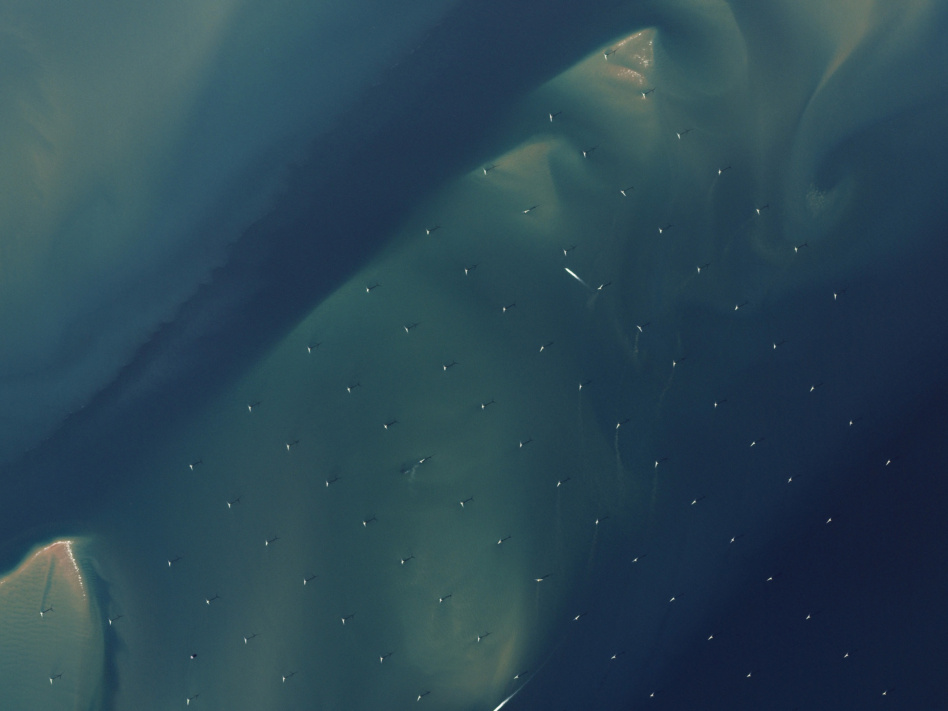
To that end, the three organizations have just lifted the wraps on the Global Renewables Watch (GRW). They describe the tool as “a first-of-its-kind living atlas” for mapping and measuring the world’s utility-scale solar and wind farms. GRW is powered by Microsoft’s cloud and AI tools, which will use Planet’s satellite imagery as its inputs. The Nature Conservancy brings specialists and subject matter expertise to the table.
Planet says that GRW builds on established, peer-reviewed scientific approaches. GRW piloted the atlas by mapping solar and wind in Germany and India, and creating solar maps of Brazil and Egypt. The first full global edition drops early next year.
Finally, the initiative is forward-looking. “Because of [GRW’s] granularity, decision-makers will be able to see the underlying patterns driving renewable energy development, and importantly, to see if any of that development may cause conflicts,” Planet wrote in a blog post. Conflicts, in this context = ecological impacts, wildlife displacement, or “taking up valuable cropland.” That can assist companies and countries deciding where to deploy their next utility-level wind or solar installation.
What gets measured gets managed
Roughly three-quarters of global greenhouse gas emissions come from energy usage. Better visibility into grid inputs is key to humanity’s decarbonization efforts.
While GRW is dynamic, it will only provide “critical data” on a biannual basis. The initiative will share the data freely. The atlas represents a time series rather than a snapshot (or, a flow rather than a stock). In terms of outputs, GRW will track renewable energy deployment targets on a country-by-country level.
Payload takeaway
Satellite imagery can excel at scale for specific use cases like this project. Measuring solar and wind on a global level would be a difficult, piecemeal process if it was done in-situ, or with drones and planes.
+ Want more? Here’s a GRW case study on measuring solar in India.

Symphony Space Unveils Adagio Hosted Payload Platform
Symphony Space is building a new model for hosting payloads—one where the satellite remains in orbit and the payloads come and go.
Contrivian Launches New Product Bundling Amazon Leo & Starlink
Customers looking for satellite connectivity are often forced to choose between one provider or another. Those days are over.

Advanced Navigation Raises $110M Series C
Not many space companies want to reduce the world’s reliance on satellite infrastructure, but that’s the pitch that landed Australia-based Advanced Navigation a $110M Series C.
Nvidia Unveils New Hardware to Unlock Orbital Data Centers
Orbital data centers may be just over the horizon, but we’re starting to get a better picture of what they’ll look like when they arrive.
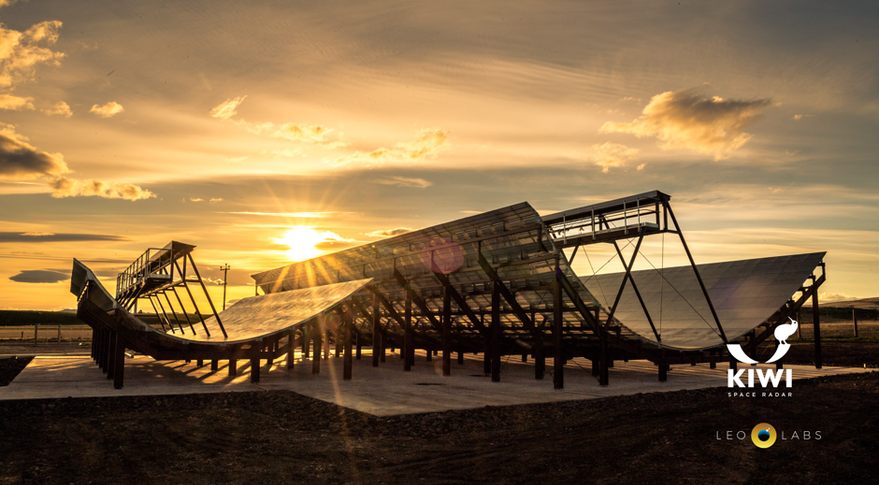
This week, LeoLabs launched a space insurance tool in beta. The tool is geared toward underwriters, who can use the service to assess the orbital debris collision hazards in LEO. Specifically, the space insurance tool will let companies and space agencies rapidly determine collision risk; calculate risk probabilities; visualize LEO; predict future collision risk evolution over a satellite’s lifespan; account for all space objects currently tracked; and run forensic analyses.
The Menlo Park startup set out to map space, one ground radar at a time. It now maintains a high-fidelity, near-real-time catalog of active (and non-active) objects in space. It’s built its own cloud tools to support its compute/storage needs and sells four data services to end users:
LeoLabs also offers TaaS—tracking-as-a-service, duh—to satellite operators, constellation developers, and future fleet owners.
Keep reading